Back to the Tech Lab
A great source of data for making spreadsheets and graphs is the WEATHER. The National Weather Service Baltimore/Washington Forecast Office Web Page is a great source of weather data.
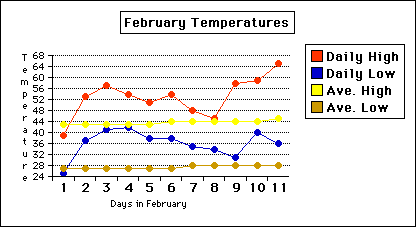
Since temperatures for February 1999 were unusually high this was the perfect data for a 70 degree day in February! Students used the Internet to access the daily high and daily low temperatures for National Airport or Dulles Airport. This data was recorded in a ClarisWorks spreadsheet. Then they accessed climate data (the average highs and average lows) for National Airport or Dulles Airport for the same time period and recorded that information into their spreadsheet. After all the data was recorded students determined a line graph would be best for showing change over time.
Here is a sample of one of our graphs.
Back to the Tech Lab