Using ClarisWorks
The Spreadsheet Tool and Make Chart
Here is a simple, but effective way to have children collect,
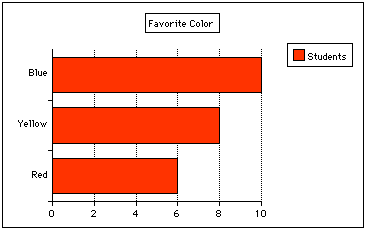
organize and record data. As a final product they can make a bar,
line, or pie graph.
- Open ClarisWorks.
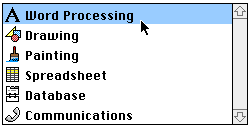
- Choose Word Processing.

- Under View, choose Show Tools.
- Click on the cross tool. This is the
spreadsheet tool.

- Move your cursor over to your word processing
document and you will notice that the cursor changes to the
spreadsheet tool. When you click and drag diagonally you will make
a spreadsheet to the size you choose. You can adjust the size at
any time by clicking on the cursor tool (the arrow), then clicking
on the spreadsheet. It will get handles and you can make it
smaller or larger or delete it.

- Now add the data. To add text or numbers to a
cell in the spreadsheet, click in that cell. Type in the
information. Your typing will appear in the text window under the
menu bar. When you hit return it will appear in the cell.

- After entering your data, highlight the
information you want shown on your graph. Then go to
Options in the menu bar and drag down to Make Chart.
Choose the type of graph you want to make.

- It's that easy to make a graph! Have
fun!
- Spreadsheets can also be used for making Data
Retrieval Charts. You can adjust the size of the cells -width and
height. See lesson on Using Spreadsheets for Data Retrieval
Charts.
Joanne Goodwin,
Technology Resource Teacher
Back to The Technology Resource
Page


