 |
 |
Send comments or questions to Joanne
Goodwin
©copyright 1997
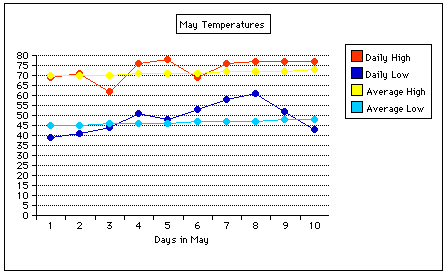
Second graders learned the difference between *daily* high and low temperatures and *average* high and low temperatures. After accessing weather data for May from the Internet, students organized the data into a spreadsheet and then made a line graph.
Here is a sample:
 |
 |
Send comments or questions to Joanne
Goodwin
©copyright 1997